MSR175 PC Software
Configuration and analysis software for the data loggers MSR175 and MSR175plus
Included with the MSR175 and MSR175plus data loggers is the software package with the programs MSR Dashboard, MSR ReportGenerator and MSR ShockViewer (basic version).
MSR Dashboard
- Mit dem MSR Dashboard ist die Konfiguration des MSR175 Datenloggers und das Auslesen der Messdaten via USB ein Kinderspiel.
Program data logger
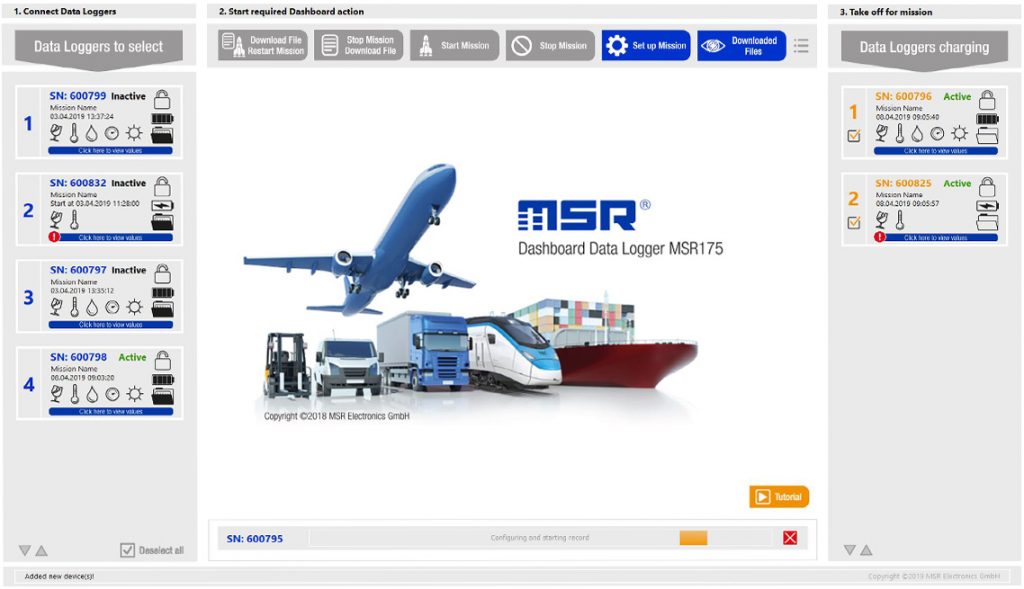
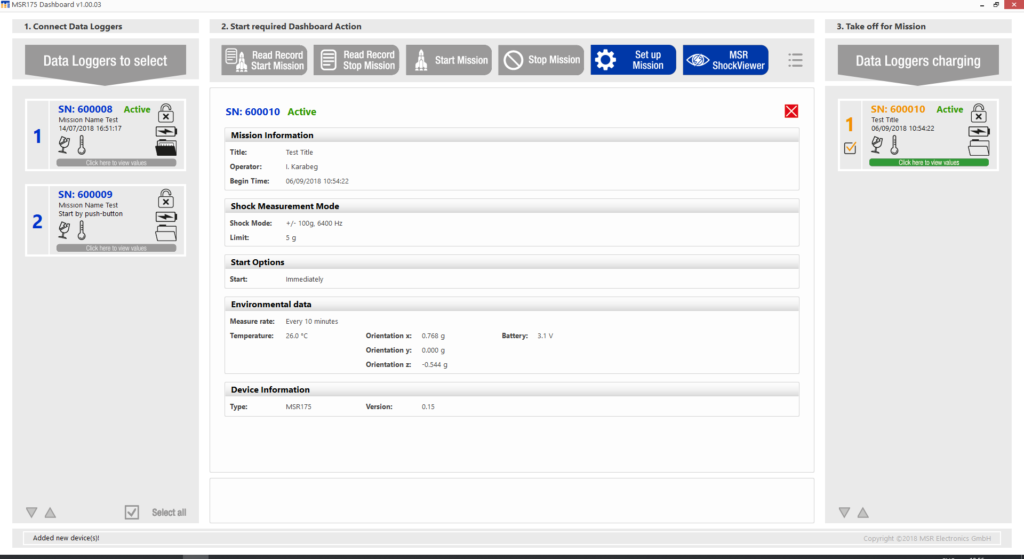
The user-friendly Dashboard software makes programming the data loggers and reading the measured data child’s play. To start up the logger, connect the data logger to the PC using a USB cable, click the data logger to be programmed and select the parameters for the measurement under «Set up Mission»: start and stop criteria, measurement channels, measurement interval and limit value setting. Subsequently, start the measurement (= «mission»).
Reading out several data loggers simultaneously
In order to read out several data loggers simultaneously, connect them to the PC using a USB cable, click on the data loggers to be read out on the Dashboard and read out the data under «Read Record Stop Mission». The measured data is automatically saved as a .msr175 file in the Windows user area of the user.
MSR ReportGenerator
 A single click on the «MSR ReportGenerator» is sufficient to quickly call up a compact, summarised report on the measured data, for example for documentation purposes. The time range to be displayed can be adjusted individually. If threshold values are exceeded, this can be identified at a glance by the coloured status information of the sensors. Convenient export functions enable you to process the data in Microsoft Excel or as a CSV text file, and to generate a PDF.
MSR ShockViewer (Basic version)
For a detailed measured data analysis of the relevant shock events, the MSR ShockViewer analysis software, which is integrated as a free basic version in the MSR175 software package, is at your disposal. To this end, select the files you wish to analyse in more detail from the list of files (.msr175 files). To do so, click «Start ShockViewer» below the list. The files are then opened in the MSR ShockViewer analysis software.
Detailed analysis of shock events
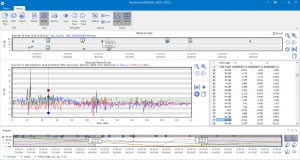
Easy to operate graphical zoom and navigation functions allow you to easily and quickly analyse extensive data volumes and determine relevant shock events. In the MSR ShockViewer, you can examine and export both the data curve and the measuring points of every individual shock.
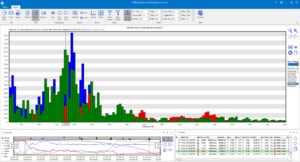
You can show and export processed spectral analysis data of the selected shock event in chart view or in table view. We offer multiple types of spectral analyses (such as Magnitude, Power Spec etc.) as well as different weighting windows (such as Rectangle, Gauss, Hamming etc.).
The insights obtained from the analysis can be useful not only to verify events causing damage when dealing with questions of liability, but the data also helps you to detect damage early and optimise packaging, as well as means and routes of transport.
- Mit dem MSR ShockViewer können Sie sowohl die Datenkurve als auch die Messpunkte jedes einzelnen Schocks untersuchen und exportieren.
Tutorials MSR175 Dashboard
Our short videos introduce you to working with the MSR175 Dashboard software.
More information
- We will inform you about updates via newsletter.
- If you have any questions, please consult our list of frequently asked questions (FAQ), contact the point of sale where you purchased your data logger or contact our support.
 Deutsch


